

Throughout Earth’s history climate instability has been the norm, especially since the launch of the ice age cycle 2.58 million years ago. With the exception of the past 9,500 years, the global mean temperature has jumped up and down by 10–12°C (18–22°F) on timescales of several millennia or less (see figures 1 and 2). Those jumps mean that any humans alive previous to 9,500 years ago would not have been able to sustain long-term agriculture leading to advanced civilization. Scientists continue to discover evidence for Earth’s recent climate stability and how it has allowed for human flourishing.
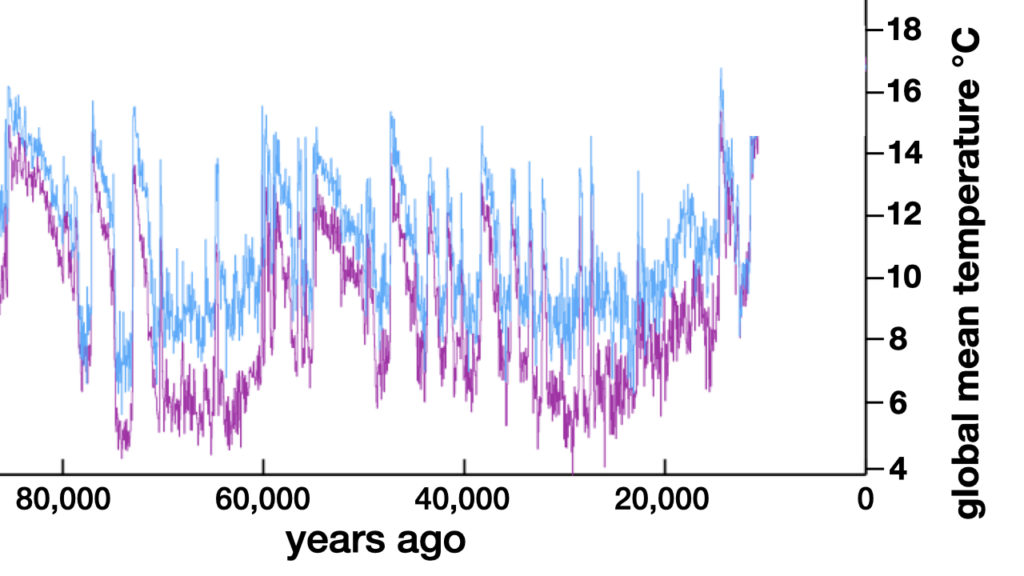
Data taken from NGRIP (blue) and GRIP (purple) ice core records. Diagram credit: Hugh Ross
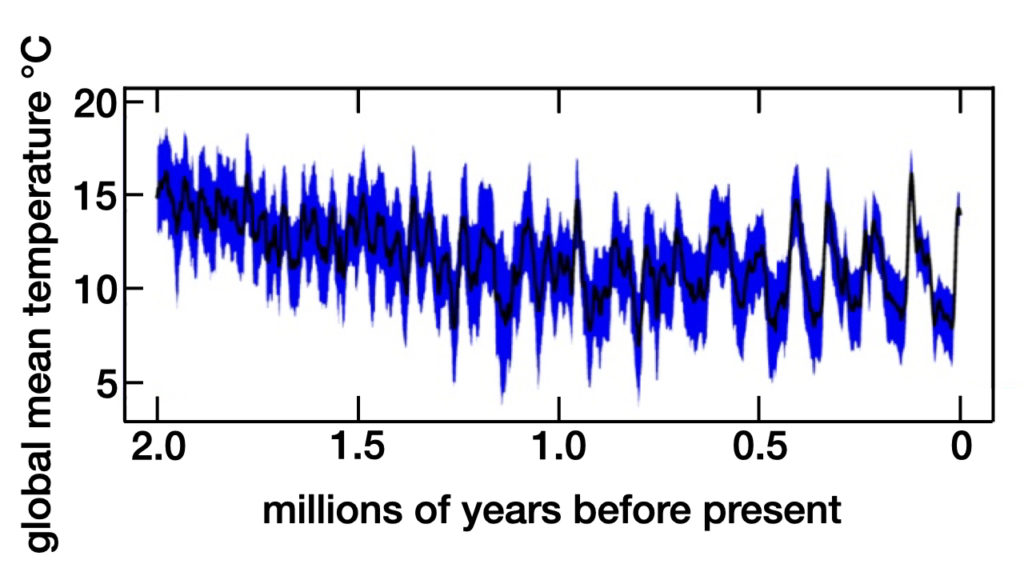
Data is taken from C. W. Snyder, Nature 538 (2016): 226. Diagram credit: Hugh Ross
During the past 9,500 years, Earth’s global mean temperature has been remarkably stable. Scientists use what is known as proxy data to reconstruct past climate conditions. These are multiple independent preserved physical characteristics that substitute as direct measurements. Data from temperature records based on ice cores from sites in central Antarctica and central and northern Greenland has shown that the global mean temperature varied by no more than ±1.25°C.1 As I reported in Weathering Climate Change, statistician Grant Foster and petrophysicist Andy May used the 28 most reliable temperature proxies from a database of 73 temperature proxy records plus an Indonesian ocean proxy to establish that the global mean temperature, in fact, has varied by no more than ±0.65°C over the past 9,500 years.2
New Temperature Reconstruction Record
Now, a team of seven geologists, climatologists, and atmospheric physicists led by Matthew Osman used newly developed techniques for incorporating temperature proxy data into the latest global climate models to produce a high-resolution reconstruction of the global mean temperature over the past 24,000 years.3 As anyone who has backpacked for extended times at high altitude knows, temperature variations are strongly correlated with elevation above sea level. Both air pressure and atmospheric water content decline with elevation. Both act to dampen temperature variations.
To eliminate elevation-driven temperature variations, Osman’s team used only marine temperature proxies. They also amassed the largest ever database of marine temperature proxy measurements. For the first time by any research team, Osman’s team created a detailed record of the global mean surface temperature from the last glacial maximum to the present. Their temperature record is shown in figure 3.
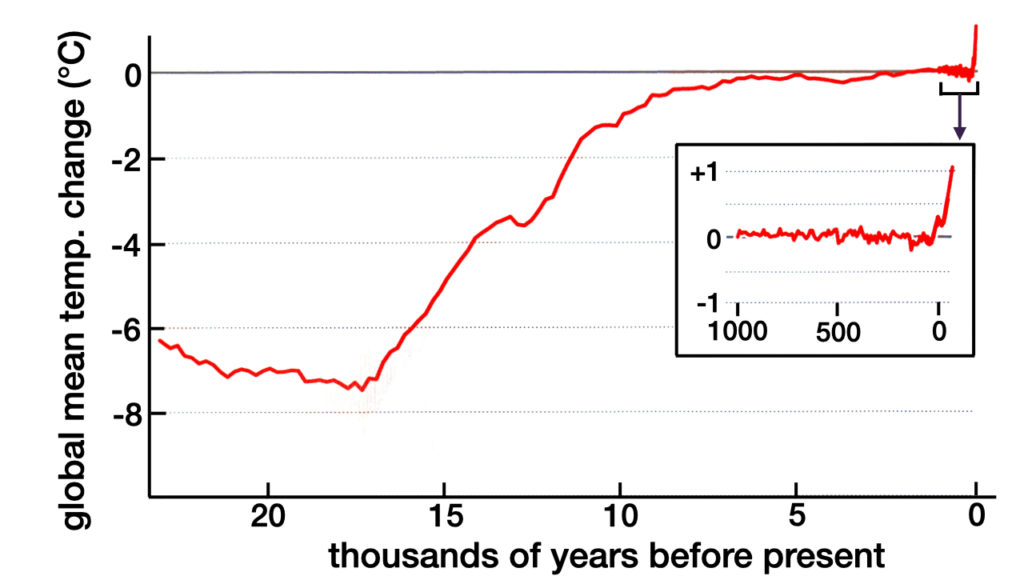
Figure 3: Global Mean Surface Temperature over the Past 24,000 Years
The y-axis zero point in both diagrams is the average global mean surface temperature from 1000–1850 AD. Adapted from figure 2 of Osman et al., Nature 599 (2021): 241 and from figure 1 of Marcott and Shakun, Nature 599 (2021): 208.
Temperature Record Revelations and Implications
The temperature record derived by Osman’s team reveals that Earth’s climate over the past 7,000 years has been more stable than what any previous research team has concluded. Over that time period, the global mean surface temperature has not varied by more than ±0.15°C. Osman and his colleagues discovered that Earth’s climate is four times more stable over the past 7,000 years than what Foster and May had derived.
The extreme climate stability over the past 7,000 years is a major factor explaining the acceleration of human civilization and technology. Thanks to this extreme climate stability, beginning about 7,000 years ago humans were able to greatly expand their agricultural productivity. This expanded productivity allowed a significant fraction of the human labor force to engage in science, engineering, technology, writing, recreation, and the arts. The ongoing extreme climate stability enabled progressively larger fractions of the human labor force to focus on those pursuits. Such transfers of labor largely explain the phenomenal technological advances achieved over the past several millennia and the rapid growth in human population.
The inset diagram in figure 3 shows the global mean surface temperature over the past 1,000 years. It reveals that from 1000–1900 AD the global climate was astoundingly stable. Global mean surface temperature variations were less than 0.1°C. The inset diagram also removes any doubt about the past century’s global warming. Since 1950, the global mean surface temperature has steadily risen to a level that is now more than ten times greater than the average temperature variations observed from 1000–1900 AD.
In a published review of the Osman team’s discoveries, two paleoclimatogists, Shaun Marcott and Jeremy Shakun, suggested a research effort to deliver even more comprehensive and reliable global mean temperature records.4 Marcott and Shakun noted that nearly all of Osman’s team’s marine temperature proxies came from the Atlantic and Arctic Oceans and from offshore regions of the Pacific, Indian, and Southern Oceans. They recommended gaining temperature proxy measurements from the central Pacific, Indian, and Southern Oceans. They also proposed using terrestrial temperature proxies where the elevation effects can be calibrated out. Thus, future research may soon reveal even more evidence for Earth’s uncanny recent climate stability.
In Revelation 7:9 the apostle John saw a vision of the redeemed host of humanity. He saw “a great multitude that no one could count from every nation, tribe, people, and language.” As I explain in some detail in Weathering Climate Change,5 God meticulously designed Earth and its climate system to make possible—within a short time period—the redemption of a great multitude, perhaps billions of human beings, from their sin. Thanks to the research achievements by Osman’s team, we have yet more evidence for God’s works of creation and redemption.
Endnotes
- Edward J. Brook and Christo Buizert, “Antarctic and Global Climate History Viewed from Ice Cores,” Nature 558 (June 14, 2018): 200–208, doi:10.1038/s41586-018-0172-5; J. Jouzel et al., “Orbital and Millennial Antarctic Climate Variability over the Past 800,000 Years,” Science 317, no. 5839 (August 10, 2007): 793–796, doi:10.1126/science.1141038; P. M. Grootes et al., “Comparison of Oxygen Isotope Records from the GISP2 and GRIP Greenland Ice Cores,” Nature 366 (December 9, 1993): 552–554, doi:10.1038/366552a0.
- Hugh Ross, Weathering Climate Change: A Fresh Approach (Covina, CA: RTB Press, 2020), 59–61.
- Matthew B. Osman et al., “Globally Resolved Surface Temperatures Since the Last Glacial Maximum,” Nature 599 (November 11, 2021): 239–244, doi:10;.1038/s41586-021-03984-4.
- Shaun A. Marcott and Jeremy D. Shakun, “Global Temperature Changes Mapped across the Past 24,000 Years,” Nature 599 (November 10, 2021): 208–209, doi:10.1038/d41586-021-03011-6.
- Ross, Weathering Climate Change, 57–224.

