Why Our Sun Is Spot On
One of the things that marks humanity’s time on Earth is the optimal conditions of our Sun, including its unusually low flare activity. New research from Japan helps explain why the Sun exhibits such low flaring and stable luminosity. Here I’ll examine the benefits they provide for life, humans in particular.
I am not known for being a flashy guy, quite the opposite, in fact. Likewise, the Sun, although it appears cheerfully bright, is not very “flashy.” Indeed, new discoveries indicate that the Sun may be the least flashy of all stars—which is a good thing for advanced life. Why does the Sun lack flashiness—or, as astronomers would put it, why does the Sun manifest so little flaring activity? A group of nine Japanese astronomers recently found that part of the answer lies with sunspots.
Starspots and Superflares
The Japanese team showed that starspots (similar to sunspots, but located on stars other than the Sun) greatly influence a star’s flare activity and superflares in particular, which are ten to a million times more energetic than the very largest that the Sun blasts off.
We found that the energy of superflares are related to the total coverage of starspots. The correlation between the spot coverage and the flare energy in superflares is similar to that in solar flares.
For many years astronomers have understood that the magnetic energy associated with sunspots determines the amount of energy in solar flares. Thus, the Japanese team suggests that “the energy of superflares can be explained by the magnetic energy stored around the starspots.”2
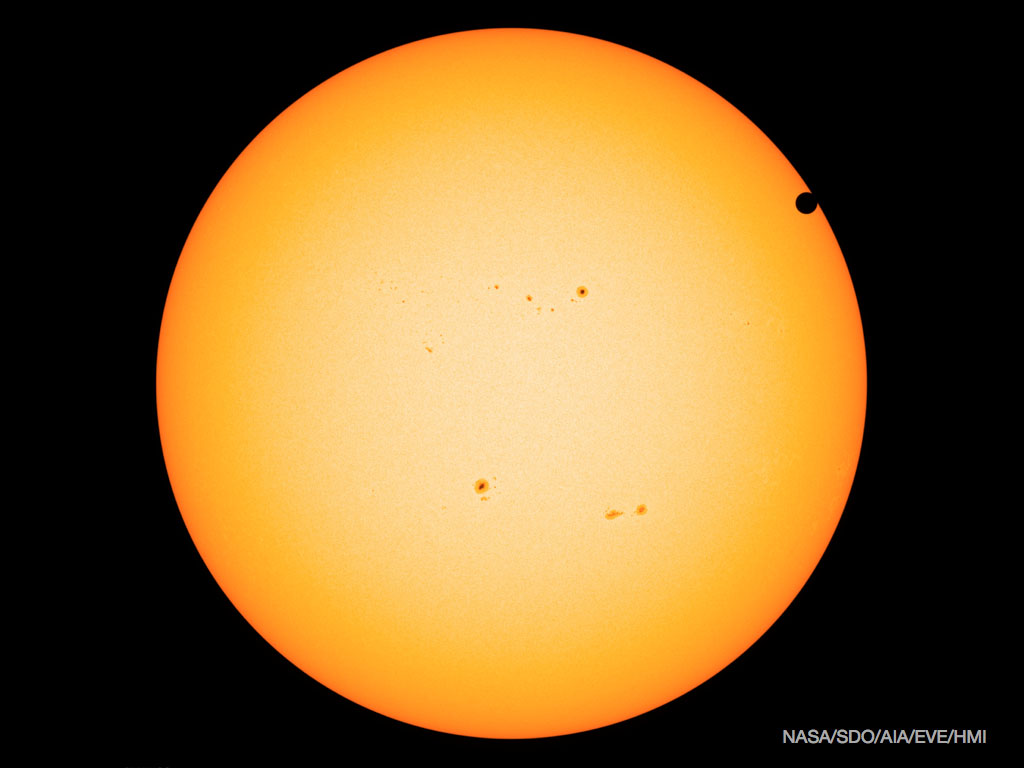
Sunspots look dark (see figure 1) because of the powerful magnetic fields associated with them. The energy output from the nuclear furnace located at the Sun’s core is uniform throughout the Sun’s interior. Therefore, the total energy output per unit surface of the Sun is constant. However, the brightness is not constant. The brightness arises from heat energy. Since the total energy = heat energy + magnetic energy, sunspot regions are cooler, and thus darker, than other parts of the Sun’s surface.
The Sun’s spot activity is not constant. It varies over an 11-year cycle, approximately. At sunspot minimum the Sun displays either no spots or only a few very tiny spots; at solar maximum the Sun will consistently display several spots that are visible through a small telescope. Currently, we are approaching the next sunspot maximum.
Figure 1: Sunspots near Solar Maximum
The dark speckles near the middle of this image are sunspots; the dark disk toward the upper left is Venus passing in front of the Sun. Note Venus’ transit, which has a negligible effect on the Sun’s total brightness, dims the Sun’s luminosity more than do all the sunspots. Because solar faculae (bright spots) often appear at the same time as sunspots, the Sun is often actually more luminous at solar maximum than it is at solar minimum.
Image credit: NASA
As illustrated in figure 1, sunspots never cover a significant fraction of the Sun’s surface. For much of the Sun’s 11-year sunspot cycle there are no sunspots at all. (In fact, only once since I started observing sunspots at age 16 do I recall seeing spots big enough for me to observe without the aid of a telescope.) Consequently, sunspots have a barely measureable impact on Earth’s climate.
Other Factors in Flare Activity
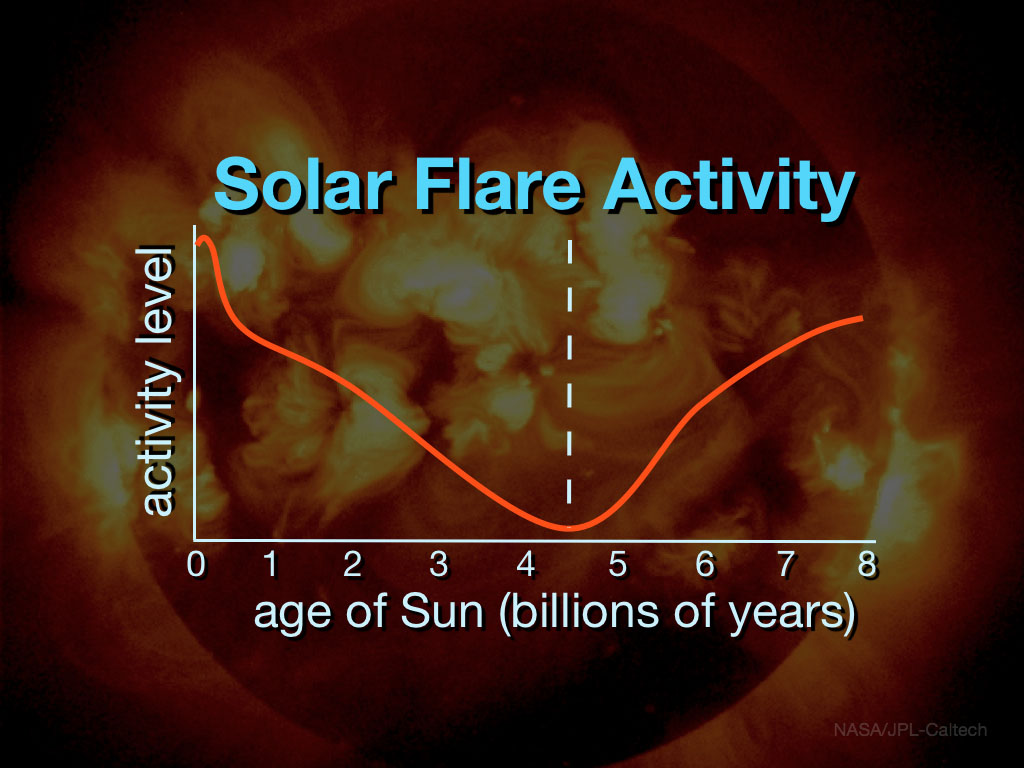
A star’s mass and age also influence its flare activity. As I sometimes mention in talks, stars are like humans in that they are most stable when they are middle-aged (see figure 2). The same is true of star size; mid-sized stars are more stable than small or large stars.
Figure 2: Intensity of Flaring Activity throughout the Sun’s Burning History
Astronomers constructed the flaring activity level by observing solar-type stars of known ages. The scale on the y-axis is logarithmic. That is, intensity levels are thousands to millions of times higher at the maximum than they are at the minimum. The dotted line indicates the Sun’s current age.
Credit for background image: NASA
When astronomers say that the Sun is mid-sized, they are referring to their spectral classification system for stars. The color of a main sequence star (that is, a star undergoing hydrogen fusion) is proportional to its mass. For example, red main sequence stars are the least massive while blue main sequence stars are the most massive. Our yellow Sun is mid-sized.
However, 89 percent of all stars in the Milky Way Galaxy are less massive than the Sun.3 These stars display dramatically greater flaring activity than the Sun.4Consequently, astronomers rule out red and orange main sequence stars as candidates for possibly hosting a planet friendly to advanced life. At the other end of the spectrum, stars more massive than the Sun also display greater flaring activity than does the Sun, although the activity is much less dramatic for these stars. However, higher mass stars burn up much faster than lower mass stars. These faster burning rates cause these stars to exhibit dramatically greater mean luminosity changes relative to the Sun. Thus, astronomers also rule out blue, white, and green main sequence stars as possible hosts for a planet capable of sustaining advanced life.
Though flaring activity does depend strongly on the star’s mass, it is more powerfully dependent on the star’s age. Young solar-type stars (those with the same mass as the Sun) frequently emit superflares.5
Young solar-type stars not only exhibit aggressive flaring, but their averaged luminosities also vary hugely from star to star. This observation is counterintuitive because mass is an accurate predictor of luminosity for hydrogen-burning stars. Such a star’s luminosity is proportional to the 3.9th power of its mass.
In a recent study of the nearest giant molecular cloud, called Lynds 1641, a team of astronomers observed that young stars with similar masses differed in luminosities with respect to one another by as much as a factor of a hundred times.6 Astronomers had observed this variation in other star clusters. They assumed that the accretion of mass from the young stars’ birthing clouds at differing rates explained the variation. However, the team that studied Lynds 1641 did extensive analysis of multi-epoch spectroscopic data on Lynds 1641’s stars; they determined that accretion variability cannot explain the luminosity differences.7
Many astronomers have suggested that a star’s rotation rate may also be an important factor concerning flaring activity and luminosity differences.8 Taking advantage of Kepler satellite observations of solar-type stars, the Japanese astronomers determined, “Stars with relatively slower rotation rates can still produce flares that are as energetic as those of more rapidly rotating stars, although the average flare frequency is lower for more slowly rotating stars.”9
What This Means for Life
Astronomers now recognize that the Sun stands apart from other stars in possessing such an extremely low level of sunspot activity. It possesses the best possible mass and is at the optimal age for minimizing sunspots on its surface. All this is critical for human health and well-being. As I described in a previous Today’s New Reason to Believe article, even the extremely minimal sunspot activity manifested by the Sun poses a slight health risk for humans at solar maximum.
The Sun’s sunspot history goes a long way to explaining why the fossil record looks the way it does. Bacteria appeared on Earth as soon as the Sun’s mass stabilized and sunspot activity subsided enough to permit their survival. As sunspot activity continued to subside more complex life-forms appeared. Humans appeared at the beginning of the very narrow time window in the history of the Sun when the sunspot activity is low enough to permit the launch, development, and maintenance of global high-technology civilization.
When it comes to the Sun and its spots, we humans have much cause to praise God’s providence. He designed the best possible star to meet our needs and, in part, to equip us to fulfill our purpose and prepare for our ultimate destiny. He placed us on Earth at the most optimal time in the Sun’s burning history when its luminosity is the most stable and its spotting activity the least disturbing. The brevity of that optimal time implies that God will fulfill His intended purposes for humanity in the present creation relatively quickly and then usher those who choose His redemptive gift into a brand new creation. Psalm 97:6 says, “The heavens proclaim His righteousness, and all the peoples see His glory.” The Sun and its few tiny spots are part of that proclamation.
Endnotes
- Yuta Notsu et al., “Superflares on Solar-Type Stars Observed with Kepler II. Photometric Variability of Superflare-Generating Stars: A Signature of Stellar Rotation and Starspots,” The Astrophysical Journal 771 (July 10, 2013): 127.
- Ibid.
- Glenn LeDrew, “The Real Starry Sky,” Journal of the Royal Astronomical Society of Canada 95 (February 2001), 32–33.
- James R. A. Davenport et al., “Multi-Wavelength Characterization of Stellar Flares on Low-Mass Stars Using SDSS and 2MASS Time-Domain Surveys,” The Astrophysical Journal 748 (March 20, 2012): id. 58; Eric J. Hilton et al., “The Galactic M Dwarf Flare Rate,” in Proceedings of Cool Stars 16 Workshop, eds. Christopher M. Johns-Krull, Andrew A. West, and Matthew K. Browning (San Francisco: Astronomical Society of the Pacific, 2012): 197; Benjamin M. Tofflemire et al., “The Implications of M Dwarf Flares on the Detection and Characterization of Exoplanets at Infrared Wavelengths,” The Astronomical Journal 143 (January 2012): id. 12; Adam F. Kowalski et al., “M Dwarfs in the Sloan Digital Sky Survey Stripe 82: Photometric Light Curves and Flare Rate Analysis,” The Astronomical Journal 138 (August 2009): 633–48; A. A. Akopian, “Frequency Distribution of X-Ray Flares for Low-Mass Young Stellar Objects in the Orion Nebula,” Astrophysics 55 (December 2012): 505–14.
- Bradley E. Schaefer, Jeremy R. King, and Constantine P. Deliyannis, “Superflares on Ordinary Solar-Type Stars,” The Astrophysical Journal 529 (February 1, 2000): 1026–30.
- Min Fang et al., “Young Stellar Objects in Lynds 1641: Disks, Accretion, and Star Formation History,” The Astrophysical Journal Supplement 207 (July 2013), id. 5.
- Ibid., 1.
- Ansgar Reiners, Nandan Joshi, and Bertrand Goldman, “A Catalog of Rotation and Activity in Early-M Stars,” The Astronomical Journal 143 (April 2012), id. 93; N. J. Wright et al., “The Stellar Activity-Rotation Relationship,” Astronomische Nachrichten 334 (February 2013): 151; E. Böhm-Vitense and J. R. A. Davenport, “The Number of Rotations Per Stellar Activity Cycle in G and K Main Sequence Stars,” in Proceedings of Cool Stars 16 Workshop, eds. Christopher M. Johns-Krull, Andrew A. West, and Matthew K. Browning (San Francisco: Astronomical Society of the Pacific, 2012): 1077; Nicholas J. Wright et al., “The Stellar Activity-Rotation Relationship and the Evolution of Stellar Dynamos,” The Astrophysical Journal 743 (December 10, 2011): id. 48; Y. Takeda et al., “Behavior of Li Abundances in Solar-Analog Stars. II. Evidence of the Connection with Rotation and Stellar Activity,” Astronomy and Astrophysics 515 (June 2010): id. A93.
- Yuta Notsu et al., “Superflares on Solar-Type Stars Observed”: 127.


