According to recent satellite data, India, now the world’s most populous nation, ranks highest (as in worst) for particulate air pollution. Not surprisingly, Delhi, India’s capital city, with a metropolitan population of over 29,000,000, ranks as the world’s most air-polluted city.1 Such pollution is more than merely unpleasant for Delhi dwellers. It is deadly.
Since 1998, an array of satellites has been tracking particulate air pollution levels all around the world. From 1998 to 2021, the average increase in such pollution over India, alone, measured 67.7%. Between 2013 and 2021, India was responsible for 59.1% of the global increase in particulate air pollution.
Can this alarming trend be checked or even reversed? Yes. I’ll explain how—given that our planet has been created with resources for the benefit of all humanity—we can remedy this problem, but first I’ll describe the scope of the challenge.
Identifying the Pollutants Researchers with the World Health Organization (WHO) identify two forms of particulate pollution: inhalable particles between 2.5 and 10 micrometers in diameter, and inhalable particles less than 2.5 micrometers in diameter, or PM2.5, the latter being the most dangerous. The major components of both kinds of particulate air pollution are black carbon soot, mineral dust, sulfates, nitrates, ammonia, and sodium chloride (salt).
In 2021, the PM2.5 air pollution over India averaged 58.7 micrograms per cubic meter (µg/m3), an increase of 4.4% over the previous year. The measure in that same year for Delhi was 126.5 µg/m3, an increase of 18.2%. This 2021 level exceeds by more than 25 times the level set by WHO as the maximum human tolerable level of 5 µg/m3. Meanwhile, ground-based instruments indicate that the city of Darbhanga in northeast India may have had an even higher PM2.5 level than Delhi that year. These instruments indicated a 2021 average PM2.5 level of 175.9 µg/m3, more than 35 times the WHO limit.2
Right behind India in dangerously high levels of PM2.5 pollution are eastern China and virtually all the nations of Southeast Asia. In China, PM2.5 air pollution takes 2.5 years off the life expectancy of the average resident, even more from those living in the largest cities.3 In Bangladesh, Nepal, and Pakistan, the effect of PM2.5 is worse yet, shortening average life expectancy by five years.4 The loss of life expectancy attributable to particulate pollution across all of Asia averages 3.3 years.5
Health Consequences Anyone who has warmed up near an open fire that’s pouring out billows of smoke has experienced the respiratory distress that comes with inhaling smoke. When it starts to irritate our lungs and nasal passages, we instinctively back away. In an open area, we benefit from this option.
Inhalable particulates from a campfire or other open fire tend to be larger than 2.5 micrometers, typically about 10 micrometers in diameter. These larger particles can penetrate deep into lungs and from there into the bloodstream, potentially causing serious health problems. However, it’s the smaller PM2.5 particles that pose the greatest health risks: decreased lung function, fibrosis, aggravated asthma, COPD, irregular heartbeat, heart attacks, lung cancer, and premature death in people with heart or lung disease.6 Children and older adults are at greatest risk from exposure.
Additionally, the PM2.5 pollution in India shows elevated levels of arsenic, tin, and lead.7 Long-term exposure to these elements is known to cause cancer and organ failure. By all indications, this pollution is a slow, stealthy killer.
Impact on Life Expectancy Exposure to PM2.5 not only degrades human health, as noted, it substantially lowers life expectancy. For India as a whole, PM2.5 air pollution shortens residents’ life expectancy by 5.3 years.8 According to the latest Quality of Life Index, the average person living in the vicinity of Delhi would live 11.9 years longer if the PM2.5 level there were reduced to 5 µg/m3 or less.9
India’s northern plains dwellers, 546 million people who constitute 39% of India’s total population, are currently on track to lose 8 years of life expectancy, due to PM2.5 air pollution.10 Clearly, exposure to PM2.5 air pollution ranks as the greatest threat to life expectancy in India, ahead of cardiovascular diseases, high systolic blood pressure, and tobacco—all of which have received serious attention in recent years. All the while, particulate pollution has only continued to increase.
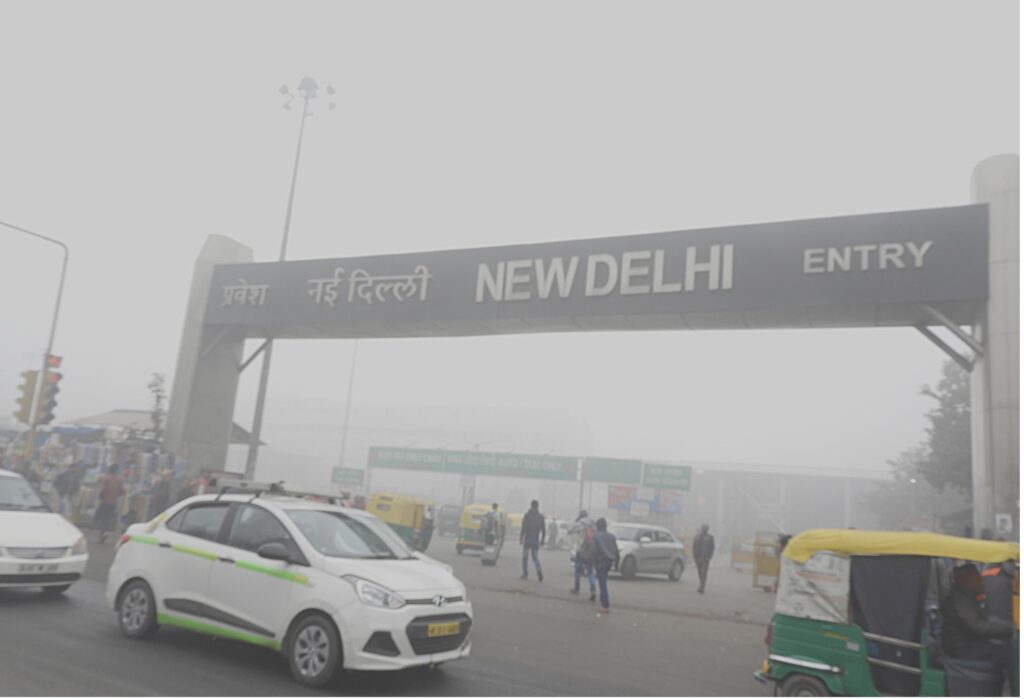
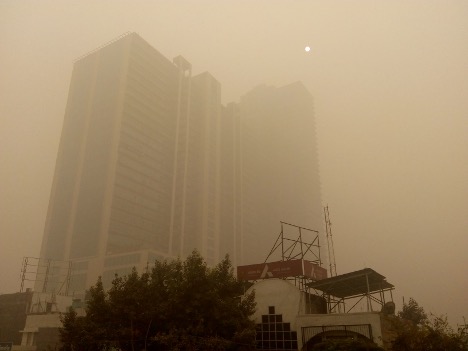
Environmental Damage PM2.5, the primary cause of reduced visibility (haze) in the atmosphere (see figures 1 and 2) also increases the acidity of lakes, streams, estuaries, seas, and oceans. It melts snow and ice, significantly contributing to global warming as it decreases the reflectivity of Earth’s surface. Additionally, it depletes soil nutrients, damages food crops, fruit trees, and forests, and even degrades buildings, bridges, monuments, and statues.
Figure 1: Low Visibility Due to PM2.5 at the New Delhi Railway Station Note that the railway building a half kilometer away is nearly invisible. Credit: Sumita Roy Dutta, Creative Commons Attribution
Figure 2: PM2.5 Air Pollution in New Delhi Significantly Blocks Sunlight Credit: Sumitmpsd, Creative Commons Attribution
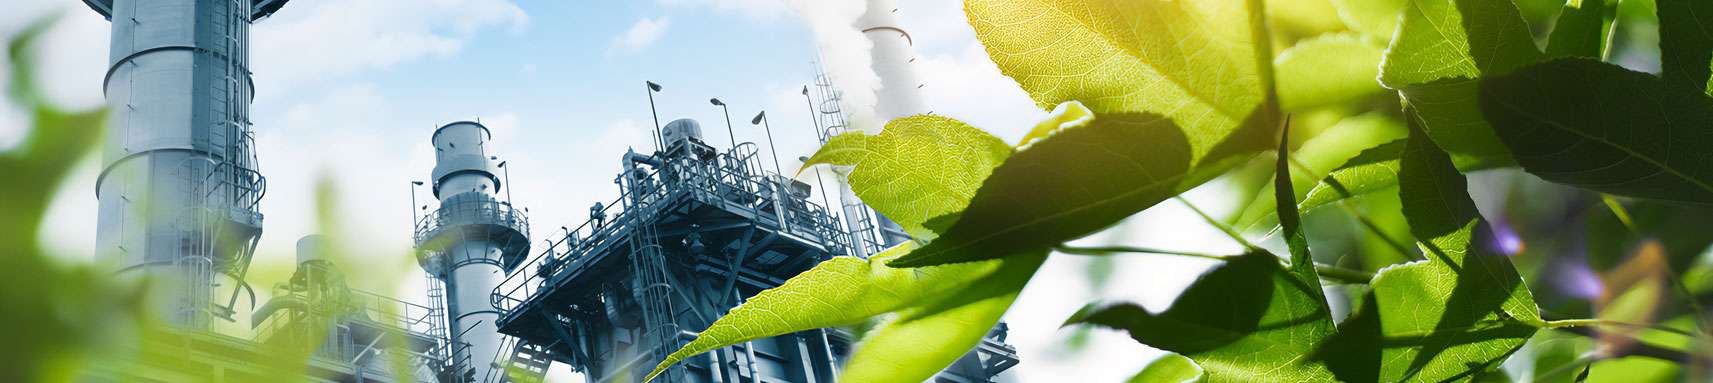
Potential Remediation Nearly all of India’s PM2.5 air pollution comes from the burning of coal, wood, biomass, diesel, oil, and gasoline, with coal as the biggest contributor.11 Replacing these fuel sources with natural gas would eliminate the majority of India’s PM2.5, leaving only the small contribution from road and construction dust. This replacement would offer the added benefit of immediately reducing India’s carbon greenhouse gas emissions by nearly half.
Natural gas, or methane (CH4), is a clean fuel in that it releases no particulates into the atmosphere as it burns. The end products are water vapor and carbon dioxide. While both water vapor and carbon dioxide are greenhouse gases, only the carbon dioxide release contributes to global warming. The extra water vapor simply condenses as rain, dew, mist, snow, hail, or frost.
In North America, natural gas is a more economical source of fuel than coal, wood, diesel, oil, and gasoline. Consequently, natural gas is used everywhere for heating and for generating electricity. When truck and car engines are converted to run on natural gas, the fuel cost for these vehicles is cut in half. Thus, for most North Americans and Western Europeans, exposure to PM2.5 air pollution poses no significant health risk. By switching to natural gas, Canada, the United States, and western Europe saw a more dramatic drop in greenhouse gas emissions than all other nations of the world.
Barriers to Potential Remediation Although natural gas is abundant and relatively inexpensive in North America, such is not the case in India, China, and Southeast Asia. Why? North America sits on a vast natural gas reserve, a supply of such size as to rid the whole world of dependency on coal, wood, diesel, oil, and gasoline fuel sources—and for less than these nations/regions currently pay.
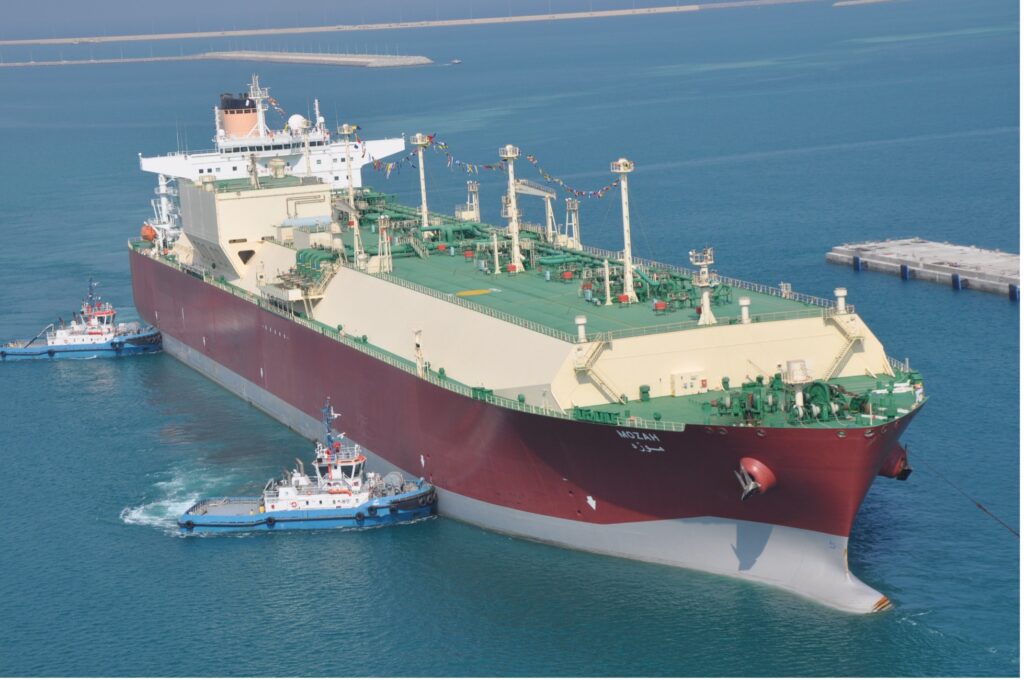
To make this resource available to the rest of the world, however, North America would have to scale up its capacity to export liquefied natural gas. The good news is that natural gas can be cooled down to liquid form, which can be easily and safely stored and transported. Liquefied natural gas takes up only 1/600th the volume of natural gas at standard temperature and pressure. Giant tanker ships have capacity to transport the equivalent of 162 million cubic meters of natural gas to ports all over the world (see figure 3).
Figure 3: Q-Max LNG Tanker Carrier With a length of 345 meters (1,132 feet) and a width of 54 meters (177 feet) the Q-Max LNG (liquefied natural gas) tanker can transport 266,000 cubic meters of liquefied natural gas—equivalent to 162,000,000 cubic meters of natural gas at normal temperature and pressure. Credit: Nakilat, Creative Commons Attribution
The problem, however, is that on January 26, 2024, the executive branch of the U.S. government made the decision to delay even considering the construction of new liquefied natural gas terminals. The stated rationale for this decision was to cut greenhouse gas emissions. Ironically, the decision does just the opposite. In effect, it forces India, China, and Southeast Asia to continue their dependence on coal, wood, diesel, oil, and gasoline. Worse yet, it perpetuates the early demise of over a billion human beings.
Spiritual Lessons The Bible tells us that God put human beings in charge of Earth’s resources to wisely manage them for the benefit of all Earth’s life (Genesis 1:28–30). Wise management implies paying attention to unintended consequences. Cathy McMorris Rodgers, Chair of the House Energy and Commerce Committee for the United States Congress, has explained the unintended consequences of limiting LNG exports.12 While the goal of eliminating virtually all greenhouse gas emissions through the development of wind, water, solar, and nuclear power is laudable, this goal will take a great deal of time to achieve—an estimated two decades, at least.
Meanwhile, it would seem both prudent and life-saving to help other nations to lower greenhouse gas emissions by replacing high-greenhouse-gas-emitting fossil fuels with the lowest-greenhouse-gas-emitting fossil fuel: natural gas. After all, this resource is the most abundant and least costly fuel available, not to mention the one and only fossil fuel that releases no particulate pollution.
God calls the descendants of Adam and Eve to live compassionately in the love and strength he alone provides. He will show us how to alleviate poverty and suffering wherever they exist, giving honor to his name. Supplying Asia with abundant natural gas would save tens of millions of lives and alleviate widespread devastation of both humans and animals. It would dramatically boost the economies of both North American and Asian nations. It would rapidly reduce greenhouse gas emissions, and, thus, effectively mitigate global warming and climate change. It would enhance the ecosystems of Asia, increasing food and forest productivity throughout the region. It would clear up the skies over Asian cities so that the 2+ billion people living in these cities could actually see stars at night. Once again, for billions of people, the heavens could—and would—declare to them the glory and righteousness of God (Psalm 19:1, 97:6).
Greenstone and Hasenkopf, “Air Quality Life Index 2023.”
Greenstone and Hasenkopf.
Greenstone and Hasenkopf.
Lukasz Zareba et al., “The Relationship between Fine Particle Matter (PM2.5) Exposure and Upper Respiratory Tract Diseases,” Journal of Personalized Medicine 14, no. 1 (January 16, 2024): id. 98, doi:10.3390/jpm14010098; Dayong Yue et al., “Diesel Exhaust PM2.5 Greatly Deteriorates Fibrosis Process in Pre-Existing Pulmonary Fibrosis Via Ferroptosis,” Environment International 171 (January 2023): id. 107706, doi:10.1016/j.envint.2022.107706; Yonghui Yang et al., “Continuous Exposure of PM2.5 Exacerbates Ovalbumin-Induced Asthma in Mouse Lung Via a JAK-STAT6 Signaling Pathway,” Advances in Clinical Experimental Medicine 29, no. 7 (July 2020): 825–832, doi:10.17219/acem/121009; Ruyi Li, Rui Zhou, and Jiange Zhang, “Function of PM2.5 in the Pathogenesis of Lung Cancer and Chronic Airway Inflammatory Diseases (Review),” Oncology Letters 15, no. 5 (May 2018): 7506–7514, doi:10.3892/ol.2018.8355.
Pallavi Pant et al., “Characterization of Ambient PM2.5 at a Pollution Hotspot in New Delhi, India and Inference of Sources,” Atmospheric Environment 109 (May 2015): 178–189, doi:10.1016/j.atmosenv.2015.02.074.
“Air Quality Life Index, India Fact Sheet.”
“Air Quality Life Index, India Fact Sheet.”
“Air Quality Life Index, India Fact Sheet.”
Abhinandan Ghosh et al., “A District-Level Emission Inventory of Anthropogenic PM2.5 from the Primary Sources Over the Indian Indo Gangetic Plain: Identification of the Emission Hotspots,” Science of the Total Environment 914 (March 1, 2024): id. 169865, doi:10.1016/j.sciotenv.2023.169865; Pant et al., “Characterization of Ambient PM2.5.”